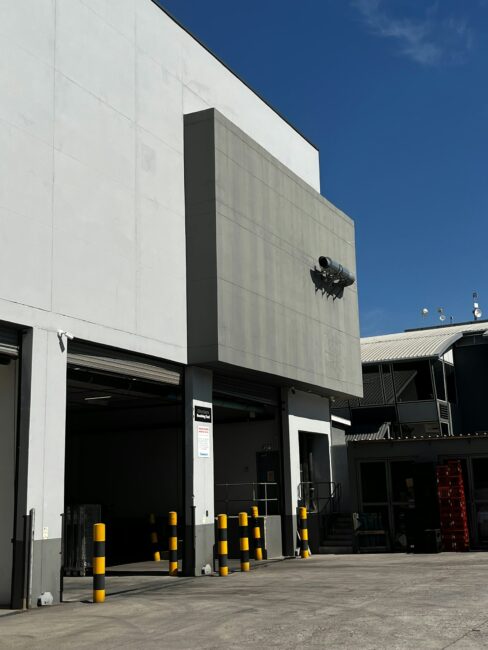
Modern industrial building with loading docks. Photo: Theo Marjoram via Unsplash, Unsplash License (free to use).
Quick Answer
Polk County’s industrial market posted about 477,000 square feet of net absorption in the third quarter of 2026, with vacancy at 7.4% and average warehouse asking rents up 13.4% year over year to $9.14 per square foot, according to Cushman & Wakefield. The construction pipeline has grown to about 2.7 million square feet, most of it still available.
How Is Polk County’s Industrial Market Performing?
Polk County, home to Lakeland and Winter Haven, sits between Tampa and Orlando, a location brokers regularly cite as its main advantage. With roughly 66 million square feet of industrial space, the county’s warehouse market is a useful gauge of logistics demand across Central Florida.
Cushman & Wakefield’s third-quarter 2026 MarketBeat report for Lakeland, which covers warehouse and distribution space in Polk County, shows a market that is absorbing space, raising rents and building more.
Polk County Industrial Snapshot, Q3 2026
| Measure | Q3 2026 |
|---|---|
| Vacancy rate | 7.4% (up 10 basis points year over year) |
| Net absorption, Q3 | About 477,000 square feet |
| Net absorption, year to date | More than 529,000 square feet |
| Total leasing activity, Q3 | 828,000 square feet |
| Deliveries, Q3 | 556,000 square feet |
| Under construction | 2.7 million square feet (up from 2.0 million) |
| Share of construction still available | About 91% |
| Average asking rent | $9.14 per square foot (up 13.4% year over year) |
Source: Cushman & Wakefield, Lakeland Industrial MarketBeat, Q3 2026.
What Did CBRE Find?
CBRE’s third-quarter 2026 Polk industrial figures describe a similar picture. CBRE reported more than 1 million square feet of new deliveries in the quarter and said overall vacancy was largely stable, with vacancy in the region’s largest buildings down sharply from its 2024 peak. CBRE said occupancy gains came from both eastern and western Polk, driven by traditional leasing, build-to-suit projects and owner-user expansions, and that asking rents continued to climb.
The two firms measure the market differently, which is why their delivery figures do not match. Cushman & Wakefield reported 556,000 square feet delivered in the quarter, while CBRE reported more than 1 million. Readers comparing reports should treat each firm’s numbers as internally consistent rather than mixing them.
How Big Is Polk County’s Industrial Market?
CBRE’s detailed second-quarter 2026 report gives the most complete breakdown of the market’s size and structure. It counted 66.13 million square feet of industrial space in Polk County.
Polk County Industrial Space by Type, Q2 2026
| Product type | Size | Vacancy | Asking rent |
|---|---|---|---|
| Distribution and logistics | 58.24 million sq ft | 8.7% | $8.43 per sq ft |
| General manufacturing | 7.24 million sq ft | 0.3% | $14.29 per sq ft |
| R&D and flex | 659,000 sq ft | 24.1% | $16.27 per sq ft |
| Total | 66.13 million sq ft | 7.9% | $8.55 per sq ft |
Source: CBRE Research, Polk County Industrial Figures, Q2 2026.
Distribution and logistics buildings make up about 88% of the county’s industrial space. Manufacturing space is nearly full, at 0.3% vacancy, which suggests very little room for manufacturers looking to move into existing buildings.
How Does Building Size Affect Vacancy?
| Building size | Inventory | Vacancy | Asking rent |
|---|---|---|---|
| Below 50,000 sq ft | 6.43 million sq ft | 8.5% | $12.95 |
| 50,000 to 99,999 sq ft | 7.20 million sq ft | 5.2% | $12.80 |
| 100,000 to 249,999 sq ft | 13.33 million sq ft | 8.7% | $9.48 |
| 250,000 to 499,999 sq ft | 15.49 million sq ft | 13.4% | $7.76 |
| 500,000 to 749,999 sq ft | 8.66 million sq ft | 7.0% | $6.75 |
| 750,000 sq ft and larger | 15.03 million sq ft | 3.2% | $7.00 |
Source: CBRE Research, Q2 2026.
The weak spot was mid-sized bulk buildings of 250,000 to 499,999 square feet, at 13.4% vacancy. The largest buildings, those of 750,000 square feet or more, were only 3.2% vacant. Smaller spaces command much higher rents per square foot, nearly $13, compared with about $7 for the biggest buildings.
How Do East and West Polk Compare?
| Submarket | Inventory | Vacancy | Asking rent | Under construction |
|---|---|---|---|---|
| Polk East (Auburndale, Davenport, Winter Haven) | 21.39 million sq ft | 3.4% | $8.88 | 1.09 million sq ft |
| Polk West (Lakeland, Bartow, Mulberry, Polk City) | 44.74 million sq ft | 10.1% | $8.48 | 955,000 sq ft |
Source: CBRE Research, Q2 2026.
East Polk is the tighter market, with vacancy of 3.4%, while West Polk, which includes Lakeland, had 10.1% vacancy. CBRE said two long-planned move-outs near County Line Road, mostly in West Polk, drove negative absorption of about 85,000 square feet in the second quarter, with one tenant relocating to Plant City in the Tampa market. CBRE also reported vacancy of 9.3% a year earlier, meaning vacancy had fallen 140 basis points year over year as of mid-2026.
Who Signed Major Leases in Polk County?
Cushman & Wakefield highlighted three of the quarter’s largest transactions:
Notable Polk County Industrial Leases, Q3 2026
| Tenant | Size | Location | Type |
|---|---|---|---|
| Nearly Natural | 413,000 square feet | Interstate 4 Logistics Hub, Northeast Lakeland | Occupancy move-in |
| HD Supply | 400,000 square feet | 6850 Firstpark Boulevard, Northeast Lakeland | Renewal |
| World Electric Supply | 274,000 square feet | Allen K. Breed Highway, Southwest Lakeland | New lease |
Sources: Cushman & Wakefield; Lee & Associates.
Lee & Associates’ third-quarter Tampa Bay report also listed the HD Supply and World Electric Supply leases, giving the World Electric Supply address as 5360 Allen K. Breed Highway and the size as 274,040 square feet. Both tenants are in wholesale distribution.
What Sold in Polk County?
Lee & Associates reported the sale of a 168,400-square-foot Class A industrial building at 2125 Interstate Drive in Lakeland for $30,372,343, or about $180.36 per square foot, as part of a portfolio sale. That price is well above the $111-per-square-foot average sale price reported for the first quarter of 2026, which reflects the premium buyers pay for newer, high-quality buildings.
How Has the Market Changed Over the Past Year?
Quarterly reports from several brokers show how Polk’s industrial market has moved from the third quarter of 2025 to the third quarter of 2026.
Polk County Industrial Trend, Q3 2025 to Q3 2026
| Period | Vacancy | Asking rent | Under construction | Source |
|---|---|---|---|---|
| Q3 2025 | 6.8% | About $8.00 per square foot | 916,104 square feet | Tampa Commercial Real Estate |
| Q1 2026 | 7.1% | n/a | 1.54 million square feet | Lakeland Chamber guest report |
| Q2 2026 | 7.9% | $8.55 per square foot | 2.04 million square feet | CBRE |
| Q3 2026 | 7.4% | $9.14 per square foot | 2.7 million square feet | Cushman & Wakefield |
Sources as listed. Vacancy and rent methodologies differ by firm, so the trend is directional rather than exact.
The clearest trend is in construction. The pipeline roughly tripled from about 916,000 square feet in the third quarter of 2025 to about 2.7 million square feet a year later. Cushman & Wakefield noted that about 91% of the space under construction was still available for lease, meaning most of it is being built on a speculative basis.
What Happened in 2025?
A December 2025 report from Tampa Commercial Real Estate covering the third quarter of 2025 described a strong year. Polk recorded 2.4 million square feet of net absorption through the first three quarters of 2025, and 1.7 million square feet of new leases were signed in the third quarter alone, more than double the first-half volume. Vacancy dropped 210 basis points in that quarter, to 6.8%, and warehouse asking rents rose 9.3% year over year.
The largest deal was PepsiCo’s lease of 1,218,800 square feet at the Central Florida Integrated Logistics Park in East Polk, the largest lease since that building’s delivery in the first quarter of 2024.
What Did the First Quarter of 2026 Look Like?
A first-quarter 2026 snapshot by Alex Delannoy, SIOR, published by the Lakeland Area Chamber of Commerce, reported countywide vacancy of 7.10%, unchanged despite 604,436 square feet of new deliveries, mostly from the Pace 570 project. Vacancy varied sharply by submarket: 2.80% in East Polk and 11.30% in North Polk, where nearly 500,000 square feet of new construction had just been completed.
Sales volume fell 60%, to $41.5 million, the average sale price was $111 per square foot, and the average cap rate held at 7.40%.
Why Are Companies Choosing Polk County?
CBRE pointed to Polk’s lower cost relative to Tampa and Orlando as one reason rents keep rising there. The data support that. Polk’s average warehouse asking rent of $9.14 per square foot in the third quarter of 2026 compares with an average NNN asking rent of $11.47 per square foot across the Tampa Bay industrial market, according to Lee & Associates. That makes Polk space roughly 20% cheaper than the Tampa Bay average, even after a 13.4% increase over the past year.
How Does Polk Compare With Tampa Bay Overall?
| Measure | Polk County (Q3 2026) | Tampa Bay (Q3 2026) |
|---|---|---|
| Vacancy | 7.4% | 7.6% |
| Average asking rent | $9.14 per square foot | $11.47 per square foot (NNN) |
| Rent change, year over year | +13.4% | About +0.8% |
Sources: Cushman & Wakefield (Polk); Lee & Associates (Tampa Bay). Tampa Bay rent change calculated from $11.38 in Q3 2025.
Tampa Bay’s overall vacancy rose from 6.2% in the third quarter of 2025 to 7.6% in the third quarter of 2026, according to Lee & Associates, while Polk’s vacancy rose only 10 basis points. Polk rents are rising much faster than the broader Tampa Bay market from a lower base.
What Projects Are Coming?
Beyond speculative buildings, Polk continues to attract owner-built facilities. Tampa Commercial Real Estate reported that Chick-fil-A plans a $150 million, 244,000-square-foot supply and distribution center at the Central Florida Integrated Logistics Park in Winter Haven. Announced in November 2025, the facility is expected to open in 2027, create more than 180 jobs and serve about 170 restaurants.
CBRE said the market appears to be entering a more balanced phase, with a meaningful amount of speculative space under construction that could push vacancy up in the near term, though the pipeline is more measured than at its peak.
Can the Market Absorb the New Supply?
A simple comparison puts the pipeline in perspective. Cushman & Wakefield counted about 2.7 million square feet under construction in the third quarter of 2026, about 91% of it still available. Year-to-date net absorption through the third quarter was a little more than 529,000 square feet. At that pace, the space now under construction equals roughly five times what the market absorbed in the first nine months of 2026.
That does not mean the buildings will sit empty. In 2025, Polk absorbed 2.4 million square feet in just three quarters, and single leases such as PepsiCo’s 1.2-million-square-foot deal can absorb a large building at once. But it does explain why CBRE expects some near-term upward pressure on vacancy as new speculative buildings are completed.
What Does This Mean for Central Florida Businesses?
For companies that need warehouse space, and for the contractors, brokers and suppliers that serve them, the Polk market offers several signals:
- Rising rents. Average asking rent rose 13.4% in a year, to $9.14 per square foot, so tenants renewing leases should expect higher costs.
- Still a discount. Polk remains about 20% cheaper than the Tampa Bay average.
- More supply coming. About 2.7 million square feet is under construction, and about 91% of it was still available.
- Submarket differences. East Polk vacancy was 2.8% in early 2026, while North Polk was 11.3% after new deliveries.
- Big users keep arriving. Leases by Nearly Natural, HD Supply, World Electric Supply and PepsiCo, plus Chick-fil-A’s planned center, show demand from national distributors and manufacturers.
Frequently Asked Questions
What is the industrial vacancy rate in Polk County?
Cushman & Wakefield reported 7.4% for the third quarter of 2026, up 10 basis points from a year earlier.
How much does warehouse space cost in Lakeland?
The average warehouse asking rent was $9.14 per square foot in the third quarter of 2026, up 13.4% year over year, according to Cushman & Wakefield.
How much industrial space is under construction in Polk County?
About 2.7 million square feet in the third quarter of 2026, up from 2.0 million in the second quarter, with about 91% still available.
What were the biggest Polk industrial leases in 2026?
Nearly Natural’s 413,000-square-foot move-in, HD Supply’s 400,000-square-foot renewal and World Electric Supply’s 274,000-square-foot lease were highlighted in the third quarter.
Which part of Polk County has the lowest industrial vacancy?
East Polk, which includes Auburndale, Davenport and Winter Haven, had 3.4% vacancy in CBRE’s second-quarter 2026 report, compared with 10.1% in West Polk.
Is Polk County cheaper than Tampa for warehouse space?
Yes. Polk’s $9.14 average asking rent compares with an $11.47 NNN average across Tampa Bay, about 20% lower.
Sources and Further Reading
- Lakeland Industrial MarketBeat, Q3 2026, Cushman & Wakefield
- Polk Industrial Figures, Q3 2026, CBRE
- 2026 Q3 Tampa Bay Industrial Market Report, Lee & Associates
- Polk County Industrial Figures, Q2 2026, CBRE
- Polk County Industrial Market: Q1 2026 Snapshot, Lakeland Area Chamber of Commerce
- Polk County Industrial Market Report, December 2025, Tampa Commercial Real Estate
About The Author